Reporting for dog walkers
Seven reports that tell you where the money went.
- Seven focused reports cover overview, income, expenses, profit and loss, payments, clients and services.
- See profit rather than turnover, because logged expenses and recurring costs are included.
- Group by day, week or month over any date range, including the months ahead.
- Every figure is built from work you've already recorded, so nothing is typed twice.
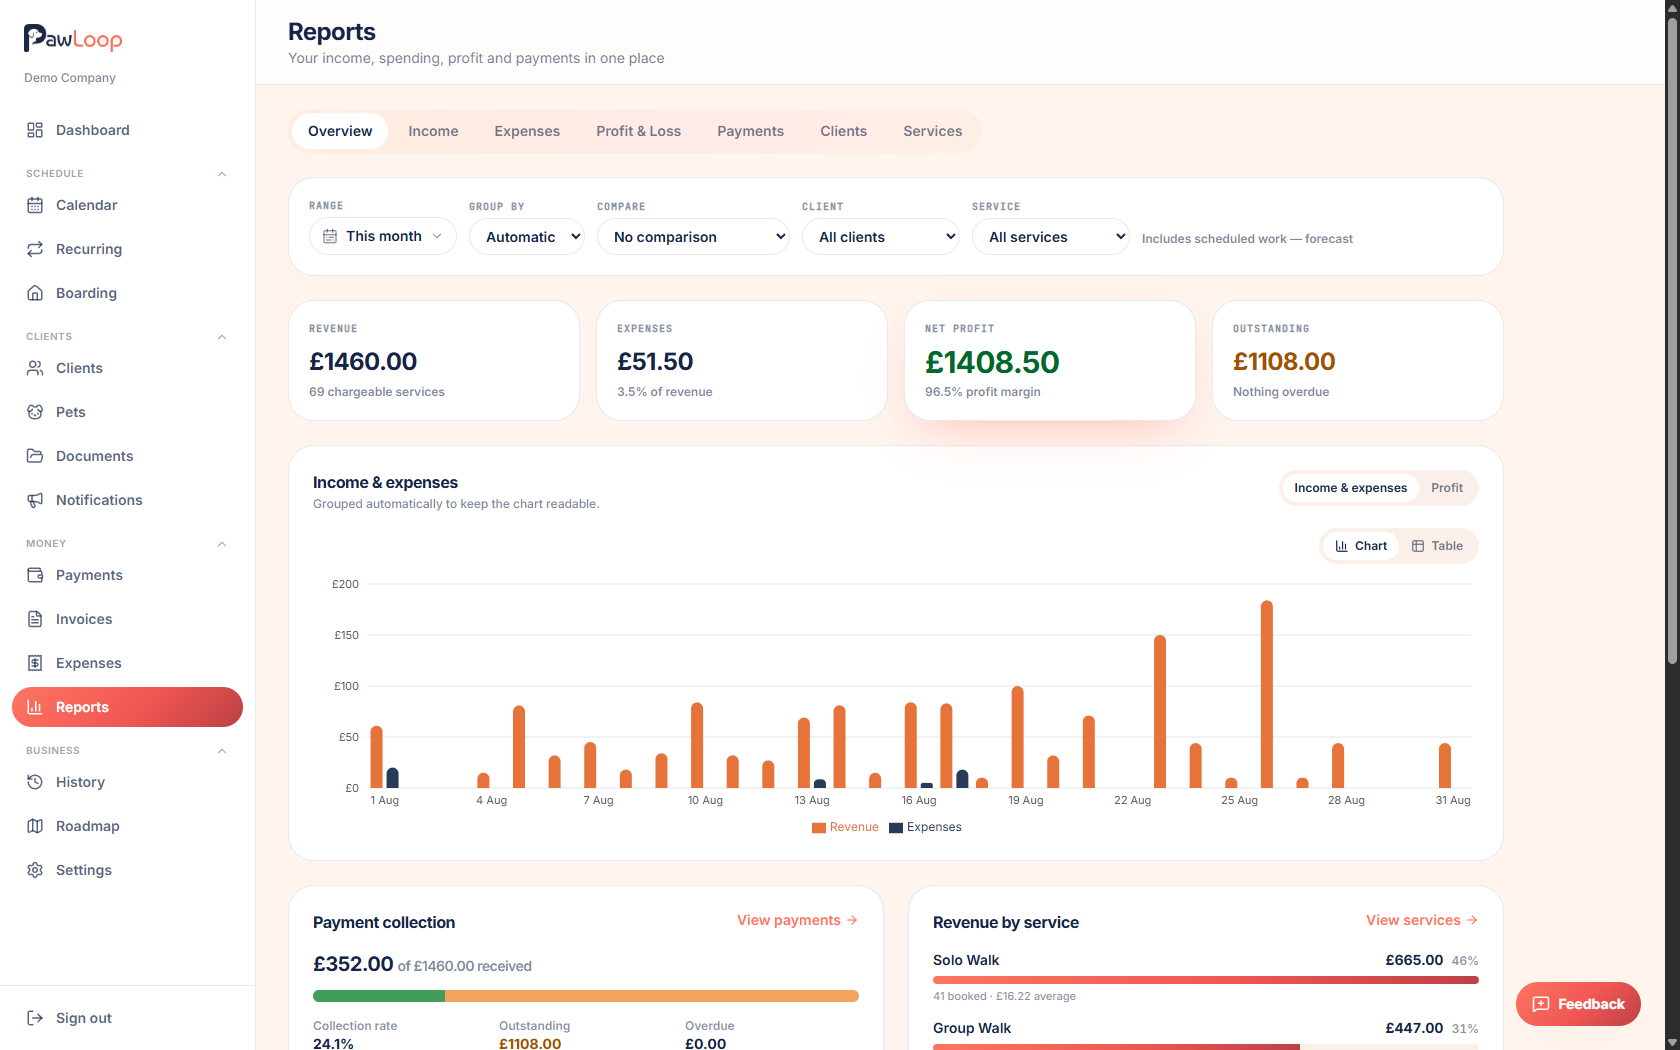
Plenty of walkers are busy without ever knowing whether they are better off than last year. The diary is full, the phone rings, and the only real answer arrives months later from an accountant. PawLoop turns the bookings, invoices, payments and expenses you are already recording into seven focused reports, so the answer takes seconds rather than an evening with a spreadsheet.
Overview gives you the headline numbers, Income and Expenses break down where money came from and went, Profit & Loss nets them off, and Payments shows what has actually been collected against what is still owed. Clients and Services rank who and what pays, which is usually the report that changes something about next month's diary. Every report groups by day, week or month across any date range, switches between chart and table, and because recurring bookings and recurring costs are projected forward you can look at the months ahead as easily as the months behind.
Key takeaways
What Reporting does for your business
Overview at a glance
Revenue, expenses, net profit and an income vs expenses chart on one screen, for any date range you choose.
Profit, not just turnover
With expenses logged, the Profit & Loss report shows what you actually kept, the number that matters at year end.
Clients and services ranked
See which clients bring in the income and which walk types earn their place in your week.
Outstanding money made obvious
The Payments report separates what's been collected from what's still owed, drawn from the same statuses as your invoices.
Look forward, not just back
Pick next month and reports include scheduled work, so you can see what's coming before it lands.
Overview, the one-screen answer
Revenue, expenses, net profit and margin for the period you pick, with an income vs expenses chart underneath. It's the report to open on a Sunday evening when you just want to know how the month is going.
Income and Expenses, side by side
The Income report breaks earnings down by day, week or month and includes the quiet days so trends are honest rather than flattering. The Expenses report does the same for costs, including recurring expenses that record themselves and, if you want it, the ones still to come.
Profit & Loss for the year end
Income minus expenses over any range, laid out the way an accountant expects to see it. With Making Tax Digital coming for UK sole traders, having this already calculated saves the annual scramble.
Payments, what's actually been collected
Paid, pending and overdue are drawn from the same statuses as your invoices and payments page, so outstanding money is a real figure rather than an estimate you'd rather not check.
Clients and Services
Rank clients by income and booking volume to see who keeps the business running, and compare walk types, day care and boarding to see which services are worth building your week around. It's often the quickest route to a price change you should have made a year ago.
Forecast the months ahead
Choose a future range, next month for example, and reports include scheduled walks and boarding stays, clearly labelled as a forecast, so you can see whether a quiet patch is coming while there's still time to fill it.
Chart or table, grouped how you like
Every trend can be viewed as a chart or as the underlying table, grouped by day, week or month, so you can eyeball the shape or read the exact figures for a particular week.
Reporting questions, answered
Create your free PawLoop account today.
Sign up in minutes and try every feature free. PawLoop starts with a 14-day free trial. Every feature included and no payment card required to sign up. Choose a plan when your trial ends.
Start free trialNo spam. No card. Just a free pass to try PawLoop.